



Water quality technology: A GIS-enabled approach to monitoring water quality


Water utilities face compounding public health, regulatory, and financial pressures that leave no room for delayed laboratory testing data. Geographic Information System (GIS) technology bridges testing delays by providing a live, location-aware view of system conditions through continuous sensor integration and spatial modeling. Unifying these spatial insights with Field Operations Management platforms helps utilities quickly pinpoint contamination sources, optimize treatment processes, and maintain regulatory compliance from intake to tap.
Clean water is a public health requirement, and failures carry a measurable price. The U.S. Centers for Disease Control and Prevention (CDC) estimates that 17 waterborne pathogens cause about 7.15 million illnesses, 118,000 hospitalizations, and $3.33 billion in direct healthcare costs in the United States each year.
Sampling and laboratory testing remain the backbone of compliance monitoring, but results can take days to come back. Geographic Information System (GIS) technology fills that window, giving utilities a live spatial view of conditions while they wait.

GIS-first field platforms help utilities pinpoint contamination sources, tune treatment processes, ensure consistent access to safe water, and notify the right people quickly.
Water systems monitor quality for reasons that show up in permits, budgets, and public meetings.
Together, these compounding public health, regulatory, and financial pressures leave utilities no room for monitoring gaps or delayed lab data. Staying compliant and protecting communities requires a live, location-aware picture of the entire system.
GIS changes how utilities understand and manage the systems they operate, particularly where water quality monitoring meets field work.
The core strength of GIS is integrating and visualizing multiple data types in a single system. Beyond mapping and collecting information, GIS combines elements relevant to water monitoring, including local topography, weather patterns, and land use, into interactive maps and models.
Continuous monitoring shortens the feedback loop by replacing delayed lab results with real-time map updates. Utilities create this live view by connecting their own internal sensors or streaming public monitoring data directly into their GIS.
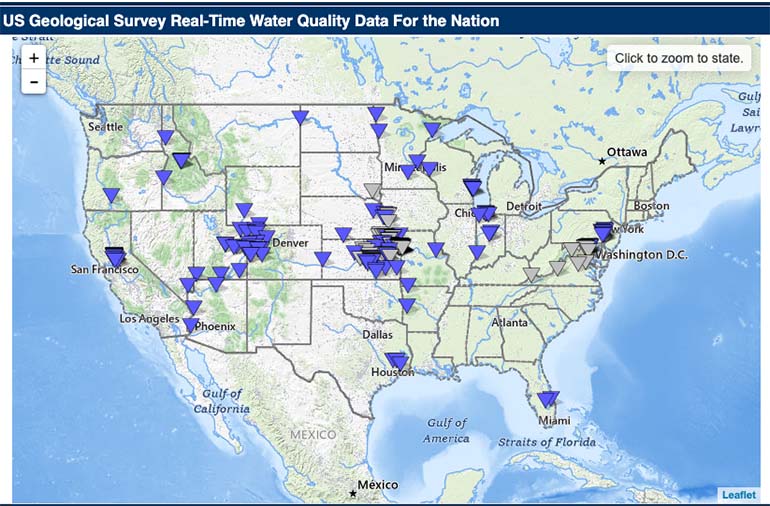
For example, the U.S. Geological Survey operates sensors that record conditions at 15- to 60-minute intervals and transmit them every one to four hours. In addition, its WaterQualityWatch network reports measurements including temperature, dissolved oxygen, turbidity, and nitrate from streams across the country. Mapping those readings gives operators a working picture of contamination levels, flow patterns, and likely sources.
Configuration matters as much as the data. Teams can connect sensors, build queries, and generate the specific reports their permits call for, which lets each utility target the conditions its own system faces.
States already use GIS under the Safe Drinking Water Act to assess source water, map watershed boundaries, and track local contamination risks. Location-first field platforms turn these static mapping requirements into active operational tools:
Water treatment requires adjusting processes as source conditions change. Mapping upstream conditions gives plant operators early warning of incoming water quality changes, allowing facilities to adjust treatment parameters before raw water reaches the intake.
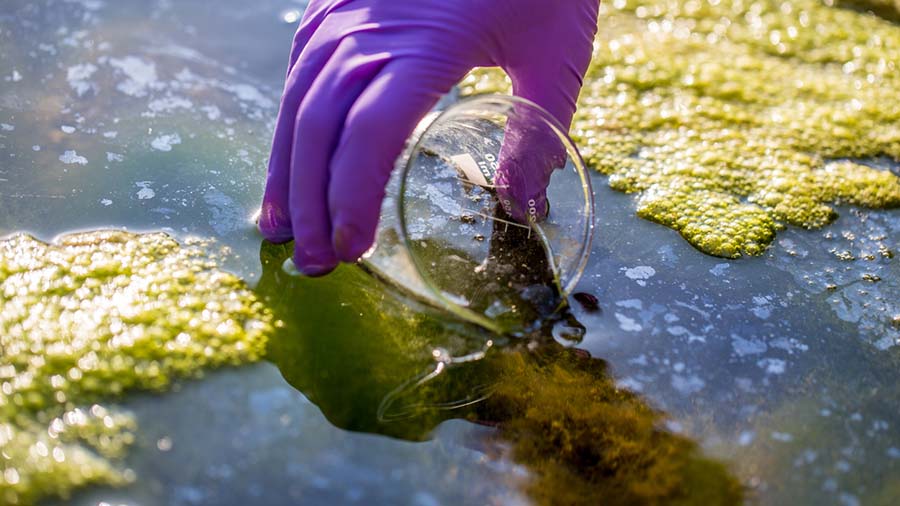
Predictive modeling expands the decision window. For example, the National Oceanic and Atmospheric Administration runs a Lake Erie harmful algal bloom forecast built from satellite imagery and circulation models. Five-day outlooks project bloom movement and depth relative to submerged intake structures. Plants use that lead time to plan treatment adjustments well in advance.
Mapped data also informs how resources get allocated. Facilities can prioritize the most affected sources and match chemical dosing more closely to measured conditions, improving both cost-efficiency and treatment performance.
The United Nations General Assembly recognized safe and clean drinking water and sanitation as a human right in 2010. Guaranteeing reliable water quality across an entire distribution network demands continuous, real-time visibility.
Continuous monitoring flags anomalies at the source, and mapping water quality across the distribution network extends that visibility from intake to tap. Analyzing trends across seasons helps utilities target maintenance and treatment before conditions degrade.
Transparency reinforces the work. Publishing water quality data through public dashboards supports the right-to-know obligations utilities already carry and gives residents a reason to trust what comes out of the faucet.
Regulatory mandates enforce strict timelines when water quality degrades. The EPA Public Notification Rule requires suppliers to alert the public within 24 hours for acute health risks, 30 days for standard violations, and up to a year for administrative non-compliance. Field platforms support those deadlines by routing automated alerts through email, SMS, and dashboard notifications.
Configurable routing aligns alerts with each utility’s specific thresholds and escalation workflows. Analyzing historical records further helps operators recognize warning patterns before conditions degrade into compliance failures.
Modern water management requires bridging spatial GIS data directly with day-to-day field execution. Location-first Field Operations Management platforms like Fulcrum turn mapping insights into actionable workflows, allowing utility crews to capture inspection records, sample logs, and repair histories in a single mobile environment.
Safe, clean drinking water depends on knowing what is happening across the entire network and having the verifiable records to prove it. Unifying continuous spatial monitoring with location-tagged field updates eliminates operational blind spots, giving utilities full regulatory confidence and complete system visibility from intake to tap.
Discover how location-driven field operations help teams capture reliable samples, respond faster to incidents, and maintain audit-ready compliance records. Contact us today for a free, personalized demo to see Fulcrum in action.
What is the financial and public health impact of waterborne pathogens in the United States?
In the United States, waterborne pathogens cause approximately 7.15 million illnesses, 118,000 hospitalizations, and $3.33 billion in direct healthcare costs each year, with roughly 1 in 44 people falling ill annually.
How does Geographic Information System (GIS) technology help water utilities manage delays in laboratory test results?
Geographic Information System (GIS) technology provides water utilities with a live, location-aware view of system conditions while waiting for laboratory testing results, which can otherwise take several days to process.
What timeline requirements does the EPA Public Notification Rule enforce for water quality non-compliance?
The EPA Public Notification Rule requires public water suppliers to issue notifications within 24 hours for acute health risks, 30 days for standard violations, and up to one year for administrative non-compliance.
How does predictive modeling assist water treatment plant operations?
Predictive modeling uses satellite imagery and circulation models to project contaminant movements days in advance, enabling water treatment plant operators to adjust chemical dosing parameters before raw water reaches intake structures.
What type of data do continuous monitoring networks like the USGS WaterQualityWatch stream into GIS platforms?
Continuous monitoring networks like the USGS WaterQualityWatch stream real-time environmental measurements, including water temperature, dissolved oxygen, turbidity, and nitrate levels, directly into GIS platforms at regular intervals.
How does spatial analysis help utilities identify the source of water contamination?
Spatial analysis overlays water sampling results with mapped industrial facilities, agricultural land, and sewer infrastructure on a single interactive map, allowing utilities to pinpoint potential contamination sources and streamline regulatory susceptibility assessments.
What is the role of Field Operations Management platforms in utility water quality workflows?
Field Operations Management platforms connect spatial GIS data directly to daily field execution by enabling mobile crews to capture location-tagged inspection logs, sample records, and repair histories in real time.
Why do utilities use public dashboards for sharing water quality monitoring data?
Utilities use public GIS dashboards to satisfy legal right-to-know obligations and foster community trust by providing residents with transparent access to distribution network water quality data.
What are the estimated economic impacts of water pollution and infrastructure needs in the United States?
In the United States, nutrient pollution and algal blooms cost the tourism industry nearly $1 billion annually, while overall national drinking water infrastructure repair and replacement needs are estimated at $625 billion.
How do automated routing alerts assist utilities with water quality management?
Automated alert systems send instant warnings via SMS, email, or dashboards when sensor readings exceed pre-set thresholds, enabling operators to address emerging water quality risks before compliance failures occur.